ORIGINAL ARTICLE
https://doi.org/10.47811/bhj.221
Road traffic accident cases at Bhutan's national referral hospital: A 13-Year retrospective study (2011-2023)
Choni Wangmo1, Gyan Gurung2, Thupten Palzang3, Norbu2
1Community Health Department, Jigme Dorji Wangchuck National Referral Hospital, Thimphu, Bhutan
2Department of Forensic Medicine and Toxicology, Jigme Dorji National Referral Hospital, Thimphu, Bhutan
3Wellbeing Clinic, Jigme Dorji Wangchuk National Referral Hospital, Thimphu, Bhutan
Corresponding author:
Dr. Choni Wangmo
cwangmo@jdwnrh.gov.bt
ABSTRACT
Introduction: Road traffic accidents are a leading cause of mortality worldwide, including in Bhutan. This study reviewed road traffic accident records maintained in the Department of Forensic Medicine and Toxicology at Jigme Dorji Wangchuck National Referral Hospital by to generate actionable insights before digitally archiving key data points and securely disposing of hard-copy records. Methods: This retrospective descriptive study included all road traffic accident records from January 2011 to December 2023. Paper-based records were digitized using Google Form and analyzed using SPSS Version 31. Results: There were 3847 RTAs with 41(1.1%) fatalities recorded during the study period. Young adults (20-29 years) accounted for the highest proportion of cases (37.7%). Individuals of Sharchop ethnicity (31.5%) and motor vehicle drivers comprised the largest group of road users (34.0%), followed by pedestrians (24.3%). Road traffic accidents were higher during summer, on Sundays, within City Core area, and between 15:00 and 18:00 hours. Off-road vehicular accidents (28%) were the most common type and the majority had injuries of extremities (92.4%). Conclusion: Historical medico-legal records provide valuable insights into road traffic accident patterns. Structured and comprehensive digital documentation, integrated with the existing electronic patient information system, is needed to support surveillance, identify high-risk periods and locations, and guide data-driven road safety planning.
Keywords: Electronic Health Records; Forensic Medicine; Traffic Accidents, Wounds and Injuries
INTRODUCTION
Globally, Road Traffic Accidents (RTA) are among the top twelve causes of death, while in Bhutan they rank sixteenth1-3. While the increasing number of RTA-related injuries in Bhutan are concerning, data available across institutions remain fragmented 3-12. A reliable RTA surveillance system requires structured, timely, and accurate data, typically collected from hospital records, police reports, and forensic documentation13.
Healthcare institutions are pivotal in producing primary data that underpin injury epidemiology and prevention planning14,15. Hospital-based RTA studies from Thailand, Sri Lanka and India have revealed key insights into risk factors, injury mechanisms, and vulnerable groups, demonstrating that even in resource-constrained settings, structured hospital documentation can effectively guide road safety policies, urban planning, and emergency response systems16-18.
The World Health Organization highlights that electronic health record systems enhance continuity of care, facilitate epidemiological monitoring, reduce administrative workload, and strengthen national data infrastructures19. Digitizing forensic documentation promotes standardization, legal robustness, data security and analytical capacity for injury mapping and judicial reporting20,21. However, successful digital transformation requires technological advancement and substantial organizational and behavioral change22-24..
Data on RTA in Bhutan is most reliant on police records, while records maintained by the Department of Forensic Medicine and Toxicology (DFMT) at the Jigme Dorji Wangchuck National Referral Hospital (JDWNRH) remain unreviewed 6-12,25. There is a potential gap in identification of patterns in RTA frequency, injury types, vehicle characteristics, and accident locations. Additionally, the growing volume of stored documents presents logistical and ethical challenges in relation to space constraint and data disposal protocols. Meanwhile, the introduction of the electronic patient information system (ePIS) in 2024 marked a significant shift towards the possibility of a more comprehensive and coordinated data management framework.
This study aims to retrospectively review RTA records from 2011 to 2023 to identify associated factors, injury patterns, documentation practices, and systemic gaps, while facilitating the digital archiving of key data elements and enabling the secure disposal of hard-copy records.
METHODS
Study design and setting
This retrospective descriptive record review was conducted at the DFMT of JDWNRH, the apex tertiary referral hospital in Bhutan. JDWNRH provides specialized medical and medico-legal services and receives referrals from across the country. DFMT is responsible for clinical assessment and medico-legal documentation of cases referred from within JDWNRH, other health centres and law enforcement agencies. These include RTA and other medico-legal conditions.
Study population
Study population comprised RTA cases documented at the DFMT between 2011 and 2023. Medico-legal documentation was done by DFMT personnel including Forensic Medicine Specialist, trained Health Assistants and Nurses, after the clinical examination of walk-in clients or patients referred from the Emergency Department and Inpatient Departments. Some were postmortem examination conducted at the site of RTA. Information was recorded on standardized forms that captured demographic characteristics, circumstances of the incident, and clinical findings related to injuries. These records were maintained as paper-based files organized chronologically within the department.
Sampling method
A census approach was adopted whereby all documented RTA cases during the study period were included. Records with incomplete or illegible information were retained where sufficient data were available for analysis, and missing variables were recorded as unavailable.
Study variables
The study variables were categorized into demographic characteristics and accident-related variables. Demographic characteristics included age, gender, occupation, nationality and ethnicity of RTA victims. The accident-related variables included road user status (driver, passenger, or pedestrian), time and location of accident, type of offending vehicle, type of collision, nature and distribution of injuries. Potential risk factors documented in the standardized form were also included.
Data management and analysis
Relevant information was extracted from the paper-based forms using a structured data extraction format developed in Google Forms. Data extraction was performed by the primary investigator and DFMT staff. All entries were cross-checked against the original records to minimize transcription errors. The extracted data were subsequently reviewed to ensure completeness and accuracy. Details about occupation and place of injury were entered as free-text which required thorough data-cleaning and re-coding.
Data were analyzed using SPSS Version 31(IBM Corp., Armonk,NY, USA), and tables and figures were generated using Microsoft Excel. Given the small number of fatalitites, RTA outcomes were classified as negligible to minor injuries or serious injuries, including fatalities.
Association between demographic
characteristics and injury outcome were assessed using Chi-square test and p
value <0.05 was considered significant. Cases with missing outcome data were
excluded from Chi-square tests. The distribution of RTA case was examined by
district, neighborhoods within Thimphu district and location types. A
descriptive location-frequency analysis was conducted using boundary
demarcation defined in the Thimphu Structure Plan 202326.
Additionally, temporal patterns (yearly, monthly and hourly distribution), types of collision, distribution of injuries and potential contributing factors documented in the RTA records were analyzed descriptively. Using the recorded dates of occurrence, the day of the week was derived for each case. To explore temporal variation, cases were categorized by day of the occurrence (Sunday to Saturday) and by season, with months grouped into four seasons. The association between seasonal variation and day of occurrence was assessed using the Chi-square test.
Ethical Considerations
This study was conducted in accordance with the ethical principles of the Declaration of Helsinki (2013). Ethical clearance (Ref. No. REBH/Approval/2020/034) was obtained from the Research Ethics Board of Health, Ministry of Health. Personal Identifiers were removed from the dataset.
RESULTS
Characteristics of the RTA victims
A total of 3847 RTA cases were recorded, among which 11% (425) had sustained serious injuries, including factalities. Nearly 81% (3120) had negligible to minor injuries and information on 7.9% (302) of the cases were missing.
Characteristics of RTA victims along with RTA outcomes are illustrated in Table 1. Age, ethnicity and road-user status had a significant association with RTA outcome.
Table 1: Characteristics of RTA victims seen in the Department of Forensic Medicine and Toxicology, JDWNRH from 2011 to 2023.
|
Characteristics |
Total
|
RTA outcomes |
p value |
||
|
Negligible to minor injuries n (%) |
Serious injuries, including fatalities n (%) |
Missing n (%) |
|||
|
Age (in years) 0-9 |
338 (8.8) |
279 (82.5) |
42 (12.4) |
17 (5.0) |
<0.001 |
|
10-19 |
415 (10.8) |
350 (84.3) |
36 (8.7) |
29 (7.0) |
|
|
20-29 |
1450 (37.7) |
1198 (82.6) |
115 (7.9) |
137 (9.4) |
|
|
30-39 |
884(22.9) |
715 (80.9) |
107 (12.1) |
62 (7.0) |
|
|
40-49 |
393(10.2) |
301 (76.6) |
61 (15.5) |
31 (7.9) |
|
|
50-59 |
199 (5.2) |
154 (77.4) |
31 (15.6) |
14 (7.0) |
|
|
60 and above |
168 (4.4) |
123 (73.2) |
33 (19.6) |
12 (7.1) |
|
|
Gender Male |
2542 (66.1) |
2052 (80.7) |
293 (11.5) |
197 (7.7) |
0.41 |
|
Female |
1305 (33.9) |
1068 (81.8) |
132 (10.1) |
105 (8.0) |
|
|
Nationality Bhutanese Non-Bhutanese Missing |
3734 (97.1) 81 (2.1) 32 (0.80) |
3026 (81.0) 71 (87.7) |
413 (11.1) 5 (6.2) |
295 (7.9) 5 (6.2)
|
0.034 |
|
Ethnicity Sharchop |
1177 (31.5) |
985 (83.7) |
119 (10.1) |
73 (6.2) |
|
|
Ngalop |
1118 (29.9) |
926 (82.8) |
113 (10.1) |
79 (7.1) |
|
|
Lhotshampa |
678 (18.2) |
548 (80.8) |
75 (11.1) |
55 (8.1) |
|
|
Khengpa |
212 (5.7) |
177 (83.5) |
21 (9.9) |
14 (6.6) |
|
|
Mixed |
26 (0.7) |
15 (57.7) |
5 (19.2) |
6 (23.1) |
|
|
Missing |
523 (14.0) |
|
|||
|
Occupation Businessman/Corporate or Private Employees / Farmers |
1419 (36.9) |
1142 (80.5) |
161 (11.3) |
116 (8.2) |
0.104 |
|
Dependent/ Housewife/ Student/ Trainee/ Unemployed |
1279 (33.3) |
1041 (81.4) |
136 (10.6) |
102 (8.0) |
|
|
Government Employee (including Armed Personnel) |
443 (11.5) |
367 (82.8) |
37 (8.4) |
39 (8.8) |
|
|
Driver |
269 (7.0) |
233 (86.6) |
22 (8.2) |
14 (5.2) |
|
|
Monk/ Nun/ Gomchen |
70 (1.8) |
52 (74.3) |
13 (18.6) |
5 (7.1) |
|
|
Missing |
367 (9.5) |
|
|||
|
Road user status Driver of motor vehicle |
1309 (34.0) |
1096 (83.7) |
115 (8.8) |
98 (7.5) |
<0.001 |
|
Front seat passenger |
674 (17.5) |
550 (81.6) |
65 (9.6) |
59 (8.8) |
|
|
Rear-seat passenger |
527 (13.7) |
440 (83.5) |
44 (8.3) |
43 (8.2) |
|
|
Passenger of Heavy vehicle |
86 (2.2) |
69 (80.2) |
13 (15.1) |
4 (4.7) |
|
|
Pedestrian |
935 (24.3) |
744 (79.6) |
131 (14.0) |
60 (6.4) |
|
|
Motor cyclist |
175 (4.5) |
119 (68.0) |
35 (20.0) |
21 (12.0) |
|
|
Bi-cyclist |
66 (1.7) |
47 (71.2) |
7 (10.6) |
12 (18.2) |
|
|
Pillion Rider |
50 (1.3) |
40 (80.0) |
7 (14.0) |
3 (6.0) |
|
|
Missing |
25 (0.6) |
|
|||
Temporal distribution of RTAs seen at the Department of Forensic Medicine and Toxicology at JDWNRH, 2011 - 2023
The number of RTA cases varied across the study period, with fluctuations observed annually. Average yearly caseload was around 292, amounting to 24 cases each month and 6 cases every week. As illustrated in Figure 1, the monthly distribution demonstrated variation in case frequency, with certain months showing relatively higher number. On the heatmap, darker shades of green indicate lowest number of cases, darker shades of red indicate the highest number of cases and yellow indicates the midpoint.
Analysis of weekly trends indicate that RTA occurrence varied by day of the week. This pattern differed significantly across seasons (p < 0.001) with Sundays recording highest number of cases (637) and summer accounting for the greatest seasonal burden (1022).
Figure 2 illustrates the hourly distribution of RTAs recorded between 2011 and 2023, with the highest proportion ocurring between 15:00 and 18:00 hours.
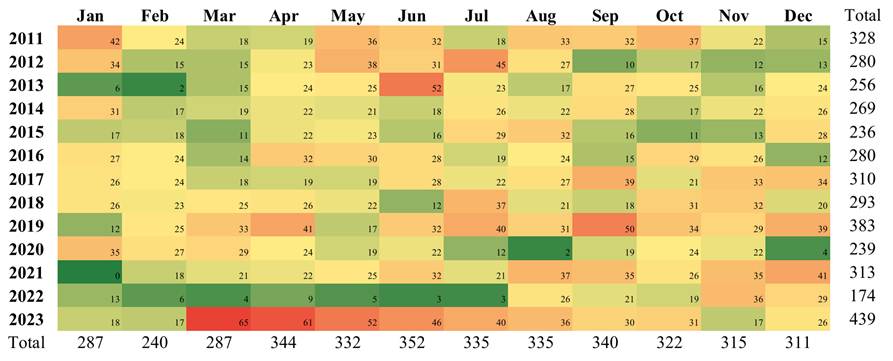
Figure 1: Month wise distribution of RTA cases seen at the Department of Forensic Medicine and Toxicology at JDWNRH from 2011 to 2023.
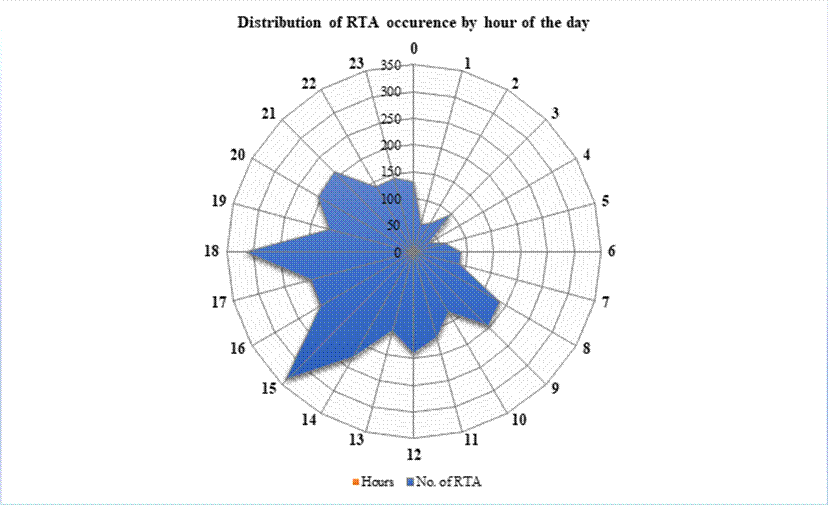
Figure 2: Hourly distribution of RTAs recorded between 2011 and 2023 at the Department of Forensic Medicine and Toxicology, JDWNRH
Location of RTA
Almost 90% of the RTAs seen at the DFMT had occurred in Thimphu. Among cases occurring outside Thimphu, the highest numbers were recorded in Paro and Wangduephodrang. There were cases reported from all other districts except Gasa, Lhuentse, Pemagatshel and Samdrup Jongkhar.
Within Thimphu, the maximum number of RTAs occurred in the core city area (538, 16.0%), followed by Babesa (317, 9.4%) and Changzamtok (256, 7.6%). Almost 90% of them had occurred on highways (1839, 47.8%) and streets (1545, 40.2%).
The annual distribution of RTAs across the ten most common locations is illustrated in Figure 3. The core city area was the single largest contributor to RTAs across 2011-2023. A drop in RTA cases was observed across most neighbourhoods in 2020 and 2022, followed by a sharp rise.
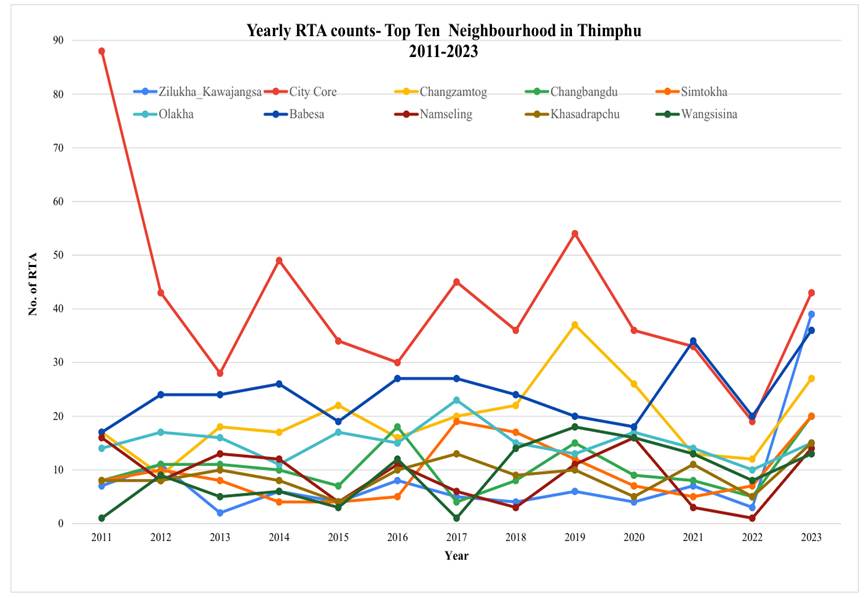
Figure 3: Yearly road traffic accidents in the ten neighborhoods with the highest RTA counts in Thimphu, recorded between 2011 and 2023
Types of Vehicles involved in RTAs
As indicated in Table 2, cars were the most common types of vehicles used by the RTA victims. Cars and trucks were the most common offending cars while lamp posts and telephone posts were the most common offending inanimate objects (Table 3).
Table 2: Types of vehicles used by the RTA victims during the time period of 2011 - 2023.
|
Vehicle types used by RTA victims |
n (%) |
|
Car |
1873 (65.3) |
|
Bolero / Jeep |
187 (4.9) |
|
Motorcycle |
175 (4.6) |
|
Truck |
172 (4.5) |
|
Van |
110 (2.9) |
|
Hilux |
100 (2.6) |
|
Bicycle |
66 (1.74) |
|
Landcruiser |
55 (1.45) |
|
Bus |
41 (1.08) |
|
Tractor |
23 (0.61) |
|
Excavator |
9 (0.24) |
|
Tanker |
4 (0.11) |
|
Power tiller |
1 (0.03) |
Table 3: Offending agents involved in the RTAs during 2011 - 2023
|
Offending Vehicle/ Animate/ Inanimate Objects |
n(%) |
|
Car |
1294 (53.8) |
|
Truck |
195 (8.1) |
|
Hilux |
143 (5.9) |
|
Side railings |
121 (5.0) |
|
Jeep/ Bolero |
106 (4.4) |
|
Van |
97 (4.0) |
|
Landcruiser |
93 (3.8) or 3.9 |
|
Culverts |
85 (3.5) |
|
Lamp/telephones post |
69 (2.9) |
|
Bike |
58 (2.4) |
|
Bus |
47 (1.9) |
|
Animals like dogs and cows |
26 (1.1) |
|
Scooter |
23 (0.9) |
|
Human |
17 (0.8) |
|
Tree |
15 (0.6) |
|
Bi-cycle |
7 (0.3) |
|
Buildings |
6 (0.2) |
|
Tanker |
4 (0.3) |
|
Excavator |
1 (0.1) |
|
Total |
2407 |
Types of collision
As depicted in Table 4, off-road vehicular accidents were the most common (28.0%) form of RTA, followed by pedestrians being hit by the front of the vehicle (16.7%). Other notable collisions included head-on collisions (11.7%) and vehicles being struck with objects (10.3%).
Table 4: Mechanism of collisions documented for the RTAs at the Department of Forensic Medicine and Toxicology at JDWNRH from 2011 to 2023.
|
Type of Collision or Crash |
n (%) |
|
Vehicle-Vehicle collision |
|
|
Head-on-collision |
449 (11.7) |
|
Head-side collision |
295 (7.7) |
|
Head-rear collision |
243 (6.3) |
|
Rear-side collision |
4 (0.1) |
|
Side-side collision |
73 (1.9) |
|
Vehicle-Pedestrian collision |
|
|
Hit by the front of vehicle |
642 (16.7) |
|
Hit by side of vehicle |
198 (5.1) |
|
Hit by rear of vehicle |
68 (1.7) |
|
Other types of crashes |
|
|
Off-road vehicular accident |
1077 (28.0) |
|
Vehicle struck with Objects |
396 (10.3) |
|
Overturned on road |
157 (4.1) |
|
Fall from moving vehicle |
21 (0.5) |
|
Objects fell / thrown on vehicle |
19 (0.5) |
|
Vehicle collided with animal |
10 (0.3) |
|
Others |
12 (0.3) |
|
Missing |
183 (4.8) |
Anatomical distribution of injuries following RTAs
Among the 2793 cases who had sustained injuries, 92.4% (2581) had injuries of extremities, followed by head and neck injuries (56.9%). Lower limb injuries (48.9%) were slightly more frequent than upper limb injuries (43.5%). Injuries affecting chest (7.8%), back (4.4%), pelvis (3.2%), and abdomen (1.0%) were relatively uncommon. Since individuals could sustain injuries involving multiple body regions, injury-site percentages were not mutually exclusive.
In terms of medical intervention, 58.1% (2234) of the cases were managed conservatively, 7.5% (290) required major procedures, 24.2% (930) underwent minor procedures and details on 10.2% (393) individuals were missing.
Documented contributing factors
Over-speeding (18.1%) and alcohol use (17.0%) were the most frequently reported risk factors. Other notable factors included mechanical failure (8.3%), unsafe overtaking or yielding (7.6%), driving without a license (5.6%) and drowsiness (5.3%). Drug use documentation was rare(0.6%).
DISCUSSION
A total of 3847 RTAs were documented in the DFMT during the years 2011 to 2023. There were 41 deaths.
When compared with the police records available from 2017 onwards, RTA fatality rate derived from DFMT for the same period (2017-2023) was 10 times lower than national level estimates27. Similarly, the fatality rate observed in this study was half of that reported for Thimphu in police records. These differences likely reflect variations in case capture and reporting mechanisms. Moreover, minor or non-fatal RTAs may not present for medico-legal evaluation. This highlights the importance of integrating multiple data sources to better understand the true burden of RTA. In addition to hospital and police records, insurance claims data may serve as valuable complementary source, particularly for capturing less severe incidents. A triangulated approach incorporating hospital, police and insurance data may provide more comprehensive and accurate representation of RTA burden. Additionally, establishing a non-punitive, digital reporting system for minor RTAs may enhance surveillance, reduce under-reporting, and facilitate data-driven policy road safety.
In line with global trend, young adults were disproportionately affected in the present study1. Studies from several South and Southeast Asian countries have also identified young adults as the most affected population28-30. However, unlike these reports, which found males to be at higher risk, the current study did not demonstrate a male predominance. Although young adults accounted for the highest number of RTA, elderly (60 years and above) showed proportionally greater vulnerability to severe outcomes.
Majority of RTAs involved drivers in cars and pedestrians, highlighting the dual need for pedestrian protection and improved driver safety. Identification of pedestrians as vulnerable road users (VRU) were in alignment with several other studies which also identified elderly as VRU16, 28, 31.
In this study, motorcyclist accounted for only 4.5% (175) of RTA cases. However, they had the highest proportion of severe injuries including fatalities and were more frequently involved in vehicle-vehicle collisions, especially with cars. In fact, cars emerged as a major contributor to RTA, both as offending vehicles (53.8%) and as the vehicle in which the RTA victims were travelling/driving (49.3%). Similarly, a study done in a metropolitan city in India identified light motor vehicles as the second most frequently involved vehicle in accidents17. First were the two-wheelers, which was similar to studies done in Sri Lanka28. The second highest RTA contributor in Sri Lanka was three-wheelers. These differences likely reflect variations in vehicle ownership patterns and transport systems between countries.
The predominance of off-road vehicular accidents and pedestrian-related collisions suggest that loss of vehicle control and pedestrians' vulnerability are major contributors to RTA. These patterns may reflect factors such as road conditions, driver behavior, and limited pedestrian safety infrastructure. The prominence of over-speeding and alcohol use further highlights the role of behavioral risk factors and underscores the need for strengthened enforcement and targeted interventions. Although potholes, poor visibility, medical or physiological conditions were noted as risk factors in the remarks section in few cases, these variables were not included in the data collection form. Therefore, identification of obstacles, road defects, and inadequate street lighting was not possible, as reported by Hadaye et al17. Additionally, the absence of precise geocoding data precluded spatial hotspot analysis, limiting the ability to examine the influence of infrastructure and environmental on RTA occurrence. Geospatial information can provide important insights into the determinants of RTAs. Hosseinur et al. found that horizontal curvature, terrain type, heavy-vehicle traffic, and access points were positively associated with head-on collisions, while higher posted speed limits and greater shoulder width were associated with lower crash frequency32. For the current study, availability of geocoded data could have enabled more detailed evaluation of contextual risk factors such as road width, street lighting, traffic junctions and presence of pedestrian pathways.
Between 2011 and 2019, the annual number of RTAs varied from a low of 236 to high of 383. A notable decline was observed between 2020 and 2022, coinciding with the mobility restriction during COVID-19 pandemic, consistent with the global trend1. While no clear linear trend was observed over time, the monthly distribution of RTA showed relatively lower counts during the colder months (December to March), suggesting seasonal variation.
Further analysis demonstrated that the temporal distribution of RTA varied significantly by day of the week across seasons, indicating that accident patterns are influenced by both seasonal factors and day-specific variations. Higher frequency of cases during weekends and certain seasons may reflect differences in travel behavior, traffic exposure, and recreational mobility. This highlights the importance of considering both seasonal and weekly temporal patterns in understanding RTA occurrence.
The hourly distribution of RTA cases showed a peak between 15:00 and 18:00 hours, coinciding with the end of the school and working day. Multifaceted interventions combining legislation, enforcement, and education have been reported to be most effective in reducing road traffic injuries in low- and middle-income countries33.
Ninety percent of RTA recorded in DFMT had occurred within Thimphu district and less than 5% were from other districts, indicating that accidents in other districts are mostly managed and recorded by local healthcare centers. This emphasizes the continued need of capacity building for healthcare workers functioning without Forensic Medicine Specialists.
The consistently higher burden of RTA in the Thimphu core city area likely reflects higher traffic density, pedestrian activity and urban congestion compared to other neighborhoods. However, the number of RTA in City Core had drastically reduced from 88 RTAs in 2011 to 43 in 2023, indicating successful measures being implemented.
Challenges
Digitizing the paper-based information was challenging due to issues like illegibility and incomplete forms. Such gaps reduce medico-legal and public health utility and mirror challenges reported in other paper-based systems15. Furthermore, the study questionnaire was based on RTA forms developed in 2010. The form underwent several amendments over the years and introduction of ePIS led to complete change in the way the data was extracted. Additionally, the fatal cases and postmortem examination reports (PMR) were not filed in RTA files. They were searched by going through the PMR files.
Strengths and Limitations
DFMT is the epitome of Forensic Medicine services in Bhutan with three Forensic Medicine specialists. The department has one of the most comprehensive medico-legal documentation processes in the country and the current study is the first that looks into RTA records. By this virtue, findings from the study could be used as a baseline to build a robust medico-legal documentation framework in ePIS. Effective digitization could improve completeness, timeliness, and analytical capacity.
While the methodology allowed for a comprehensive understanding of the existing documentation landscape, a few limitations are acknowledged. The manual nature of data extraction may have introduced transcription errors despite rigorous checks. Inconsistent data fields across years reduced the scope for certain longitudinal comparisons. Some qualitative insights were constrained by illegible handwriting or non-standard medical terminology. Nevertheless, these limitations further justify the need for digitization and reinforce the rationale for the recommendations arising from this study.
Future direction
This retrospective analysis of 13 years of RTA data highlights the strategic importance of aligning historical medico-legal records with the hospital's recent transition to ePIS. Integrating improved forensic RTA data into ePIS would enable longitudinal analysis. This could be done by standardizing diagnosis code like ICD 11 for RTA, creating built-in validation rules, drop-down menus, and standardized medical terminologies to reduce missing data and inconsistencies observed in paper-based records. A well-designed ePIS framework would enable real-time reporting, and improved interoperability between clinical, forensic, and administrative systems. ePIS could be used to establish a unified forensic data pathway that improves case traceability, strengthen injury mortality surveillance, legal process and injury burden estimation.
The incorporation of geocoding into RTA documentation would further enhance the analytical value of these records by allowing precise spatial mapping of accident locations, identification of high-risk corridors and hotspots, and correlation with road infrastructure and traffic patterns. Such spatial intelligence would support targeted road safety interventions and urban planning decisions.
Additionally, it is imperative to design a clear data governance structure to ensure digitized forensic RTA records are actively used for decision-making rather than remaining as passive repositories. In future, forensic data from ePIS could be integrated into a national RTA surveillance system where data from insurance, road infrastructure, police and other relevant agencies could be monitored, analyzed and used for better policy decisions.
Realizing these benefits, however, depends on organizational change for readiness and development of appropriate human resource capabilities, including digital literacy, geospatial data interpretation skills, and cross-sector collaboration with traffic and urban planning agencies. By integrating technology, people, and process change, JDWNRH can transform forensic RTA records from static archives into dynamic decision-support tools that strengthen public health planning, legal accountability, and institutional performance.
CONCLUSION
This study highlights the value of historical medico-legal records in understanding road traffic accidents and informing road safety planning. The observed temporal and seasonal patterns support a shift from reactive documentation to proactive, data-driven prevention. Standardized and complete digital documentation, integrated within the existing ePIS framework, is needed to improve data quality and accessibility. Strengthening collaboration between health services, traffic authorities, and urban planners can further support evidence-based road safety measures. Sustainable data governance is essential to ensure that medico-legal records are preserved and used for public health, quality improvement, and legal accountability.
ACKNOWLEDGEMENT
The authors gratefully acknowledge the late Dr. Pakila Drukpa, Bhutan's first Forensic Medicine Specialist, whose pioneering vison and work laid the foundation for this study. His foresight established an invaluable foundation for systematic collection of forensic data.
We extend our sincere gratitude to Dr. Kurt Nolte, Distinguished Professor Emeritus from the University of New Mexico, USA, who inspired the initiation of this study in 2020 and provided invaluable guidance throughout the process.
We would also like to thank the staff of the DFMT at JDWNRH for their valuable support during data collection.
REFERENCES
1. World Health Organization. Global status report on road safety 2023: summary. 2023. 11p. [Full Text]
2. Asian Transport Observatory. Bhutan Road Safety Profile 2025 [Internet]. Asian Transport Observatory; 2025 [cited May 2026]. Available from: https://asiantransportobservatory.org/analytical-outputs/roadsafetyprofiles/b]hutan-road-safety-profile-2025/
3. Asian Transport Observatory. Bhutan [Internet]. Asian Transport Observatory. [cited May 2026]. Available from: https://asiantransportobservatory.org/documents/29/Bhutan.pdf
4. Lhazom D. 2023 records highest number of motor vehicle accidents since 2020. BBS. January 16, 2024. [Full Text]
5. Rabten S. 72 killed in vehicle accidents till September, 2024. Business Bhutan. October 30, 2024. [Full Text]
6. Royal Bhutan Police. Statistical Yearbook 2017. Planning and Research Division, RBP HQ, Thimphu: Bhutan. [Full Text]
7. Royal Bhutan Police. Statistical Yearbook 2018. Planning and Research Division, RBP HQ, Thimphu: Bhutan. [Full Text]
8. Royal Bhutan Police. Statistical Yearbook 2019. Planning and Research Division, RBP HQ, Thimphu: Bhutan. [Full Text]
9. Royal Bhutan Police. Statistical Yearbook 2020. Crime Record and Analysis unit, RBP HQ, Thimphu: Bhutan. [Full Text]
10. Royal Bhutan Police. Statistical Yearbook 2021. RBP HQ, Thimphu: Bhutan. [Full Text]
11. Royal Bhutan Police. Statistical Yearbook 2023. Planning and Development Division, RBP HQ, Thimphu: Bhutan. [Full Text]
12. Wangdi C, Gurung MS, Duba T, Wilkinson E, Tun ZM, Tripathy JP. Burden, pattern and causes of road traffic accidents in Bhutan, 2013-2014: a police record review. Int J Inj Contr Saf Promot. 2018; 25(1):65-9. [Full Text] [DOI]
13. Hatamabadi HR, Vafaee R, Haddadi M, Abdalvand A, Soori H. Necessity of an Integrated Road Traffic Injuries Surveillance System: A Community-Based Study. Traffic Inj Prev. 2011; 12(4):358-62. [Full Text] [DOI]
14. Mansuri FA, Al-Zalabani AH, Zalat MM, Qabshawi RI. Road safety and road traffic accidents in Saudi Arabia. A systematic review of existing evidence. Saudi Med J. 2015; 36(4):418-24. [PubMed] [Full Text] [DOI]
15. Babu BV, John KR, Manickam P, Kishore J, Singh R, Mangal DK, et al. Development and Implementation of Integrated Road Traffic Injuries Surveillance - India (IRIS-India): A Protocol. Adv J Emerg Med. 2019; 4(2):e35. [PubMed][Full Text] [DOI]
16. Lakmal MAC, Ekanayake E, Kelum SHP, Gamage BD, Jayasundara JASB. Hospital-Based Case Series Analysis of Road Traffic Trauma Patients in Sri Lanka. Indian J Surg. 2020; 83(Suppl 1):120-5. [PubMed] [Full Text] [DOI]
17. Hadaye RS, Rathod S, Shastri S. A cross-sectional study of epidemiological factors related to road traffic accidents in a metropolitan city. J Family Med Prim Care. 2020; 9(1):168-72. [PubMed] [Full Text] [DOI]
18. Sae-Tae N, Lim A, Kakchapati S, Ueranantasun A. Hospital reported factors associated with mortality among road traffic accident victims in southern Thailand. Southeast Asian J Trop Med Public Health. 2018; 49(4):717-26. [Full Text]
19. Dhingra D, Dabas A. Global Strategy on Digital Health. Indian Pediatr. 2020; 57:356-8. [Full Text] [DOI]
20. Chango X, Flor-Unda O, Gil-Jimenez P, Gomez-Moreno H. Technology in Forensic Sciences: Innovation and Precision. Technologies. 2024; 12(8):120. [Full Text] [DOI]
21. Casey E, Souvignet TR. Digital transformation risk management in forensic science laboratories. Forensic Sci Int. 2020; 316:110486.[PubMed] [Full Text] [DOI]
22. Stoumpos AI, Kitsios F, Talias MA. Digital Transformation in Healthcare: Technology Acceptance and Its Applications. Int J Environ Res Public Health. 2023; 20(4):3407. [PubMed] [Full Text] [DOI]
23. Hospodkova P, Berezna J, Bartak M, Rogalewicz V, Severova L, Svoboda R. Change Management and Digital Innovations in Hospitals of Five European Countries. Healthcare (Basel). 2021; 9(11):1508. [PubMed] [Full Text] [DOI]
24. Mauro M, Noto G, Prenestini A, Sarto F. Digital transformation in healthcare: Assessing the role of digital technologies for managerial support processes. Technol Forecast Soc Change. 2024, 209:123781. [Full Text] [DOI]
25. JDWNRH. Annual Report 2018. Thimphu, Bhutan [Full Text]
26. Thimphu Structure Plan 2023.146 p. [Full Text]
27. Royal Bhutan Police. Statistical Yearbook. Thimphu: RBP HQ, Thimphu: Bhutan; 2017-2023. [Full Text]
28. Fernando DM, Tennakoon SU, Samaranayake AN, Wickramasinghe M. Characteristics of road traffic accident casualties admitted to a tertiary care hospital in Sri Lanka. Forensic Sci Med Pathol. 2017;13(1):44-51. [PubMed] [Full Text] [DOI]
29. Vinish V, Chakrabarty J, Vijayan S, Nayak BS, Shashidhara YN, Kulkarni M, et al. Prevalence of road traffic injuries in South East and South Asian region - A systematic review. J Neurosci Rural Pract. 2023;14(2):214-23. [PubMed] [Full Text] [DOI]
30. Ghosh S, Kazi FN, Sharma JVP. Audit of Motor Vehicle Accidents at a Trauma Center. Cereus. 2022;14(4):e23729. [PubMed] [Full Text] [DOI]
31. Kim S-C, Lee H-J, Kim J-M, Kong S-Y, Park J-S, Jeon H-J, et al. Comparison of epidemiology and injury profile between vulnerable road users and motor vehicle occupants in road traffic fatalities. Traffic Inj Prev. 2019; 20(6):581-7. [PubMed] [Full Text] [DOI]
32. Hosseinpour M, Yahaya AS, Sadullah AF. Exploring the effects of roadway characteristics on the frequency and severity of head-on crashes: case studies from Malaysian federal roads. Accid Anal Prev. 2014; 62:209-22. [PubMed] [Full Text] [DOI]
33. Staton C, Vissoci J, Gong EY, Toomey N, Wafula R, Abdelgadir J, et al. Road Traffic Injury Prevention Initiatives: A Systematic Review and Metasummary of Effectiveness in Low and Middle Income Countries. PLoS One. 2016;11(1):e0144971. [PubMed] [Full Text] [DOI]
|
AUTHORS CONTRIBUTION Following authors have made substantial contributions to the manuscript as under: CW: Conceptualization, data collection, data analysis, manuscript writing and review GG: Data collection, data analysis, manuscript writing and review TP: Conceptualization, data collection and review N: Conceptualization, data collection, manuscript writing and review Authors agree to be accountable for all respects of the work in ensuring that questions related to the accuracy and integrity of any part of the work are appropriately investigated and resolved. |
|
CONFLICT OF INTEREST |
|
None |
|
GRANT SUPPORT AND FINANCIAL DISCLOSURE |
|
None |